
如何自定义图表中的图例的图像和颜色?
问题描述
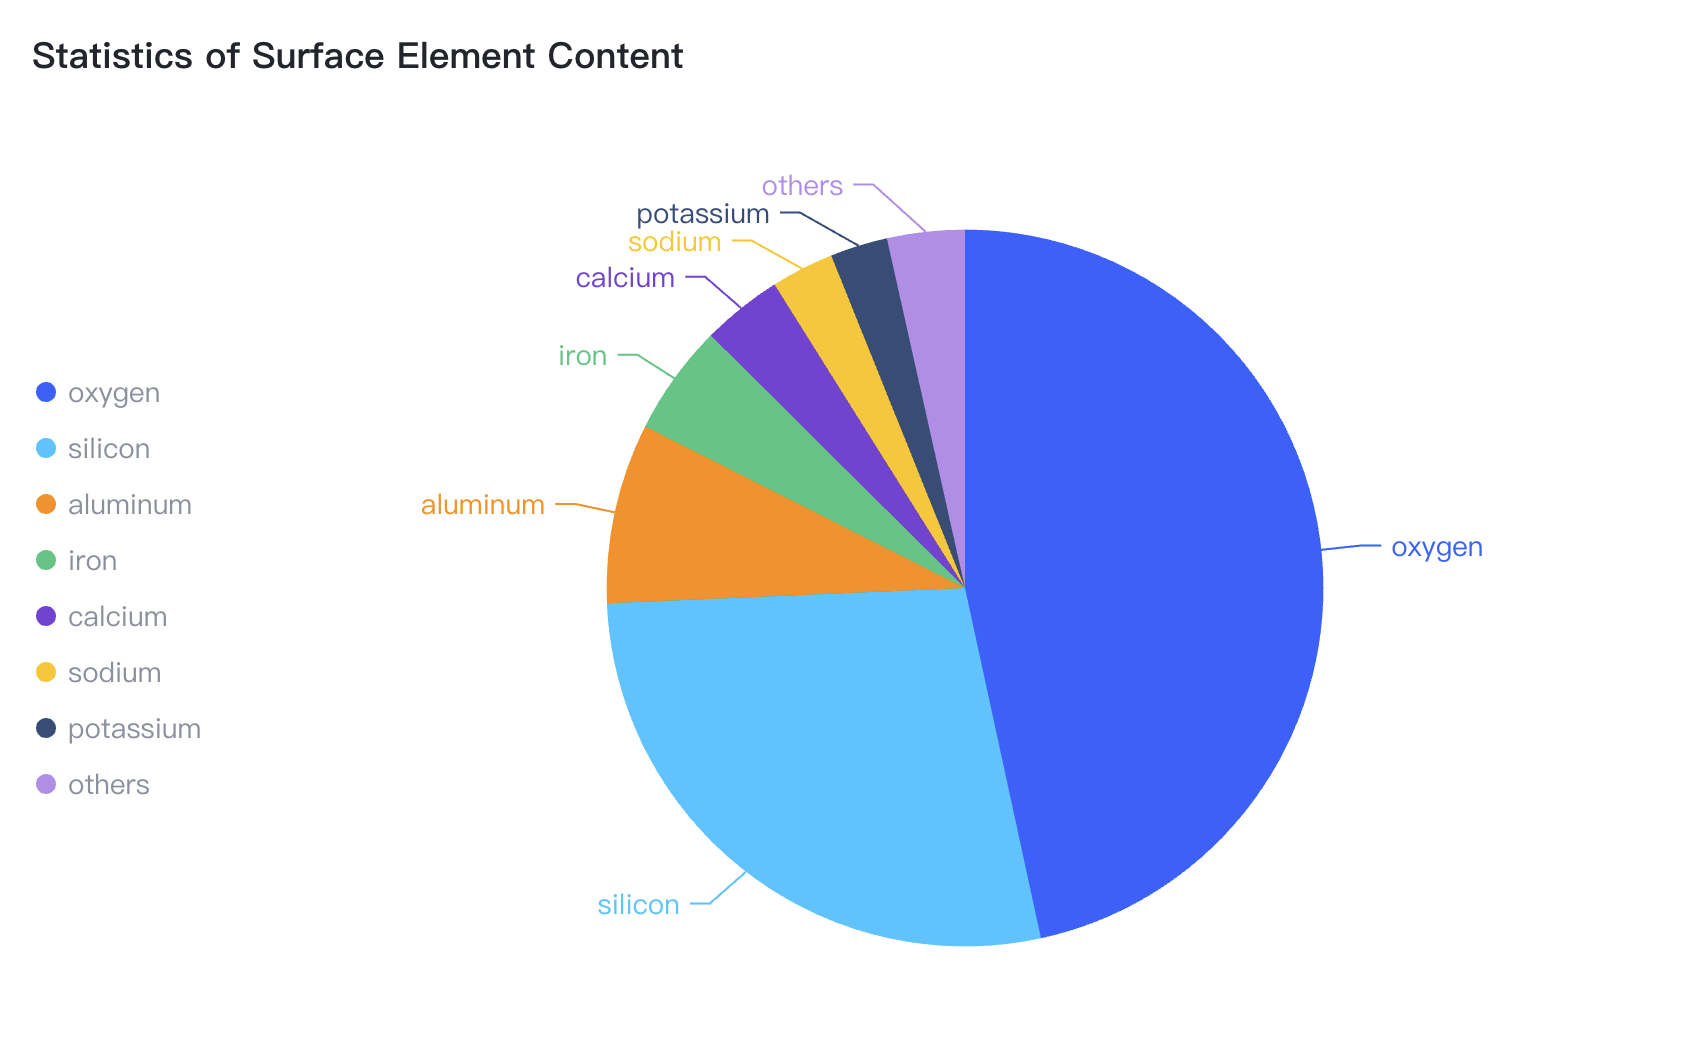
类似这样的饼图,图例的图像、颜色、内容可以自定义?如何自定义配置?
解决方案
图例是图表中常用的组件,很多类型的图表都支持图例的展示和配置,在 VChart 中:
- 通过配置
legend.item来对所有的图例项设置统一的样式 - 通过配置
legend.data回调函数来对每个图例项设置不同的内容以及样式
代码示例
- 通过配置
legend.item来对所有的图例项设置统一的样式
const spec = {
  type: 'pie',
  data: [
    {
      id: 'id0',
      values: [
        { type: 'oxygen', value: '46.60' },
        { type: 'silicon', value: '27.72' },
        { type: 'aluminum', value: '8.13' },
        { type: 'iron', value: '5' },
        { type: 'calcium', value: '3.63' },
        { type: 'sodium', value: '2.83' },
        { type: 'potassium', value: '2.59' },
        { type: 'others', value: '3.5' }
      ]
    }
  ],
  outerRadius: 0.8,
  valueField: 'value',
  categoryField: 'type',
  title: {
    visible: true,
    text: 'Statistics of Surface Element Content'
  },
  legends: {
    visible: true,
    orient: 'left',
    item: {
      width: '15%',
      shape: {
        style: {
          background: 'https://lf9-dp-fe-cms-tos.byteorg.com/obj/bit-cloud/log.jpeg',
          symbolType: 'rect',
          fill: false
        }
      },
      label: {
        style: {fontSize: 14, fontWeight: 'bold' }
      },
      value: {
        alignRight: true,
        style: {
          fill: '#333',
          fillOpacity: 0.8,
          fontSize: 10
        },
        state: {
          unselected: {
            fill: '#d8d8d8'
          }
        }
      }
    }
  },
  label: {
    visible: true
  },
  tooltip: {
    mark: {
      content: [
        {
          key: datum => datum['type'],
          value: datum => datum['value'] + '%'
        }
      ]
    }
  }
};
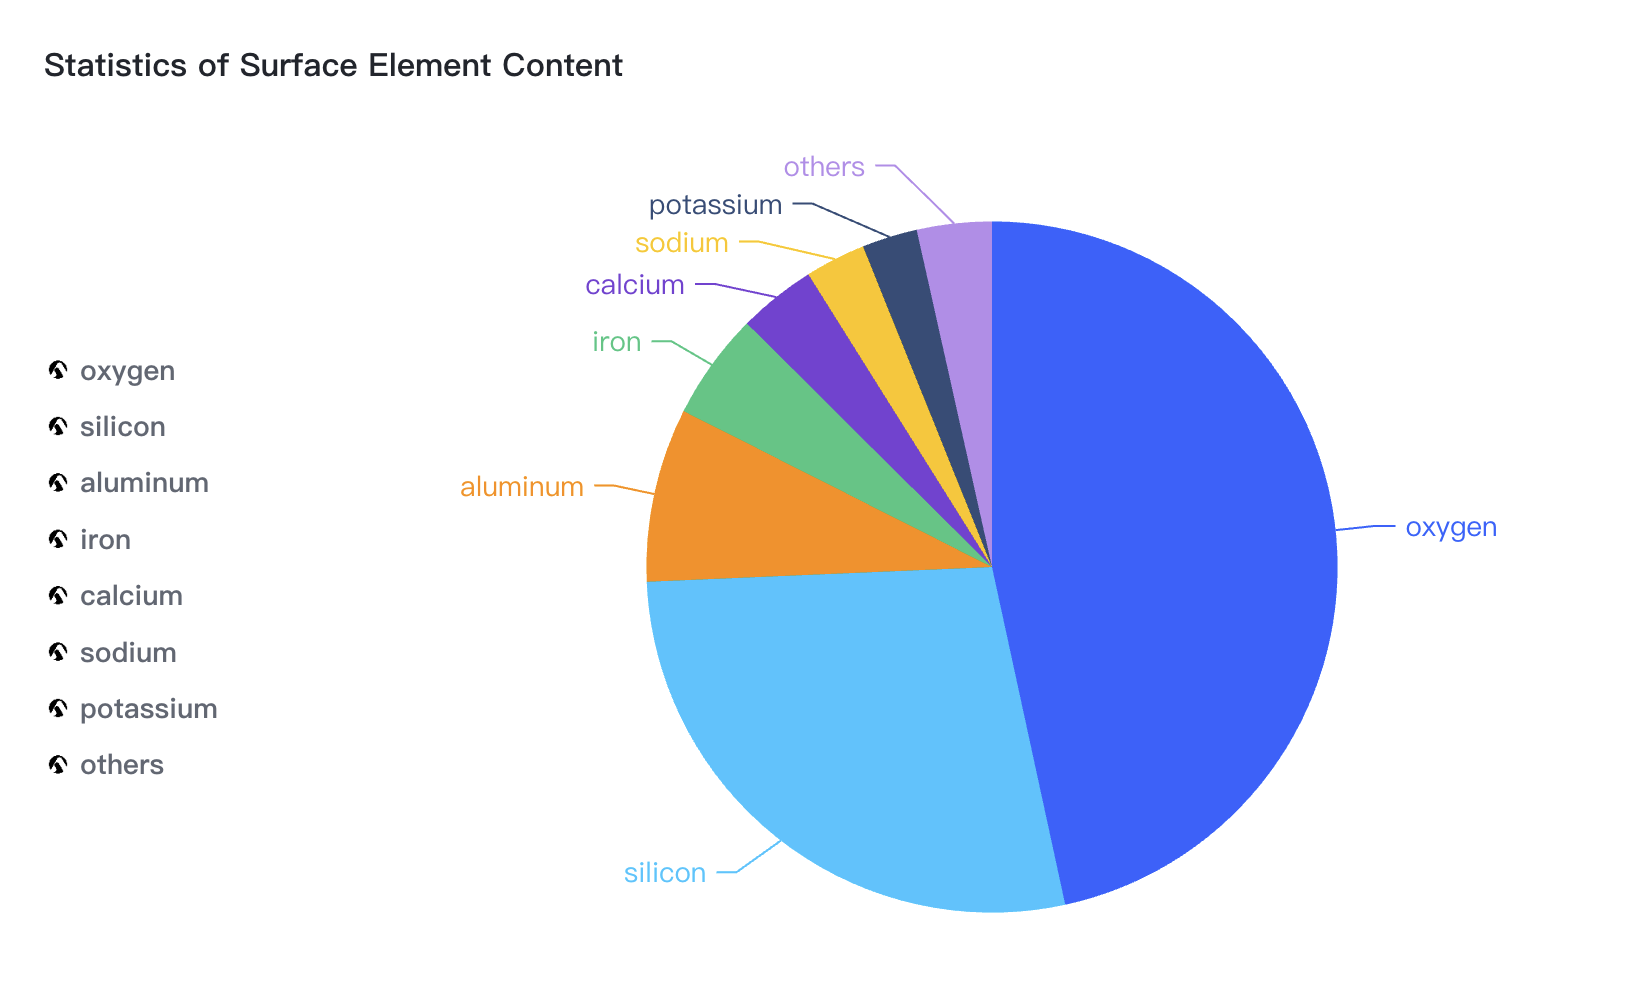
- 通过配置
legend.data回调函数来对每个图例项设置不同的内容
const values = [
  { type: 'oxygen', value: '46.60' },
  { type: 'silicon', value: '27.72' },
  { type: 'aluminum', value: '8.13' },
  { type: 'iron', value: '5' },
  { type: 'calcium', value: '3.63' },
  { type: 'sodium', value: '2.83' },
  { type: 'potassium', value: '2.59' },
  { type: 'others', value: '3.5' }
];
const spec = {
  type: 'pie',
  data: [
    {
      id: 'id0',
      values,
    }
  ],
  outerRadius: 0.8,
  valueField: 'value',
  categoryField: 'type',
  title: {
    visible: true,
    text: 'Statistics of Surface Element Content'
  },
  legends: {
    visible: true,
    orient: 'left',
    data: (items, scale,c, d) => {
      console.log(items, scale, c, d);
      return items.map(item => {
        item.value = values.find(entry => entry.type === item.label).value;
        item.shape.symbolType = 'rect';
        item.shape.background = 'https://lf9-dp-fe-cms-tos.byteorg.com/obj/bit-cloud/log.jpeg';
        item.shape.fill = false;
        return item;
      });
    },
    item: {
      width: '15%',
      label: {
        style: {
          fontSize: 14,
          fontWeight: 'bold'
        }
      },
      value: {
        alignRight: true,
        style: {
          fill: '#333',
          fillOpacity: 0.8,
          fontSize: 10
        },
        state: {
          unselected: {
            fill: '#d8d8d8'
          }
        }
      }
    }
  },
  label: {
    visible: true
  },
  tooltip: {
    mark: {
      content: [
        {
          key: datum => datum['type'],
          value: datum => datum['value'] + '%'
        }
      ]
    }
  }
};